Call us now:
86-22-8834 5196
LIFTCHEM-UV Curing Raw Materials, Pharmaceutical Intermediates
Industry Brief · Specialty Chemicals · Nov 2026 · Data as of Q3 2026
BASF sold its entire photoinitiator business in August 2016 — the Mortara plant in Italy and the Irgacure trademarks and patents included. Yet a large share of market reports still ranks BASF as the global No.1. That single outdated fact says a lot about how opaque this niche has remained, and it is the reason we rebuilt the category from primary sources: listed-company filings, regulatory texts and industry statistics.
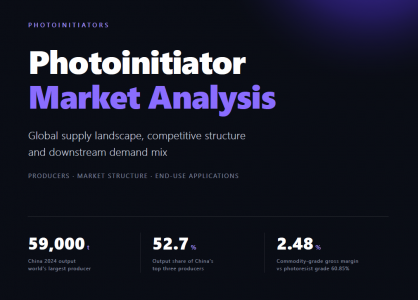
Photoinitiators account for only 3–6% of a UV-curing formulation's cost, yet they determine the curing speed and yield of the entire production line. The category is small — roughly RMB 5 billion a year in China — but it sits exactly where three curves intersect: supply-side shakeout, the light-source transition, and value stratification. Here is what the data actually shows.
| 59,000 t | 52.7% | 2.48% | 365–405 nm |
| China 2024 output — the world's largest producer and exporter | Output share of China's top three producers | Commodity-grade gross margin, vs 60.85% for LCD photoresist grade | The narrow bands of UV LED that are re-sorting the whole product mix |
Photoinitiators fall into free-radical and cationic types by initiation mechanism; free-radical products account for roughly 73%–75% of global consumption. The real commercial stratification happens within each family: absorption wavelength decides which light source a product can pair with, while solubility and migration behavior decide which end-uses it can enter.
| Class / Mechanism | Representative grades | Absorption | Key properties | Main battleground |
|---|---|---|---|---|
| α-Hydroxyketones (Norrish I) | 184 / 1173 / 2959 | 240–330 nm | Fast surface cure, non-yellowing; short-wave absorption, poor LED fit | Wood clearcoats, plastics coatings |
| Acylphosphine oxides (Norrish I) | TPO / TPO-L / 819 | 350–420 nm | Deep cure, photobleaching; well matched to LED and thick films, but phosphorus feedstock makes costs volatile | White coatings, thick films, PCB inks |
| α-Aminoketones (Norrish I) | 907 / 369 / 379 | 230–320 nm | Efficient in pigmented systems when synergized with thioxanthones; low odor | Packaging printing inks |
| Benzophenones (Norrish II) | BP / MBF / OMBB | 250–350 nm | Lowest cost, requires amine synergists; migration issues restrict food-contact use | General industrial coatings |
| Thioxanthones (Norrish II) | ITX / DETX | 380–420 nm | Red-shifted, LED-friendly; visible yellowing, suited to dark systems | Pigmented inks, electronics coatings |
| Iodonium / sulfonium salts (cationic · PAG) | 250 / 270 / 290 series | Mostly deep UV | Oxygen-inhibition free, low shrinkage; expensive, highest technical barrier | Semiconductor photoresists, encapsulation |
Why the LED transition matters more than any price movement. Mercury lamps are broadband — energy spans 254–436 nm, so almost any initiator catches some of it. UV LEDs emit only four narrow bands (365/385/395/405 nm), so products absorbing below 300 nm, such as 184 and 1173, largely stop working. Formulators are being pushed toward acylphosphine oxide and thioxanthone systems — a formulation-level rebuild that lifts both demand and pricing power for the TPO family at the same time.
The industry went through a price war in 2022–2023, with China's market size falling back to around RMB 4.6 billion. Recovery began in 2024, driven by environmental substitution and high-end applications:
The 2025 supply shock was an accidental shakeout, not a cycle reversal. Two same-source incidents in Ningxia — the Wokailong shutdown (13,000 t idled over environmental violations) and the April 2025 Yifan Bio explosion, which forced a full park-wide shutdown — plus a fire at a Yangfan New Material subsidiary cut industry supply by 12%–18%. Yet the leading producers themselves state in their filings that the market remains in oversupply. Reading the 2025 spike as an "industry turnaround" is the most common mistake in this category.
Where we are in 2026: the reason for higher prices has changed. H1 2026 prices were driven by feedstock inflation as crude rose, plus panic buying in March–April after the February geopolitical conflict pulled demand forward; meanwhile some competitors' idled capacity came back online. The 2026 recovery rests more on cost-push and mix improvement than on demand expansion.
The global market splits cleanly into two layers. The upper layer is the "formulation solutions" system, selling product portfolios and regulatory support; the lower layer is the "single-product-at-scale" system, selling cost and delivery.
Nominal capacity of major producers within China (t/y, incl. under construction and idled):
| Producer | Capacity (t/y) | Note |
|---|---|---|
| Jiuri New Material (688199.SH) | 23,000 (+3,000 under construction) | World's largest by output; full line of 20+ products |
| Qiangli New Material (300429.SZ) | 17,000 (+6,000 under construction) | Few Chinese company spanning PCB, LCD and semiconductor photoresist grades |
| Wokailong | 13,000 (idled) | Environmental violations; idled but not yet cleared from the market |
| IGM Resins (Anqing site) | 12,000 | Global capacity higher incl. Italy and Haimen sites |
| Yangfan New Material (300637.SZ) | 8,000 | Global share leader in 907; export-heavy |
| Gurun Technology | n.a. | Unlisted; cationic and niche specialty types |
Regionally, Asia-Pacific accounts for over 60% of global consumption and capacity, with China at the core; virtually all new global capacity lands in China. Europe is the strictest regulatory market — low-migration and food-contact requirements emerge there first, then spill over into global standards. North America and Japan concentrate on high-purity grades for semiconductor, medical and high-end electronics.
| Company | Capacity (10k t/y) | 2024 output (10k t) | Latest operations (2025–2026 H1) | Strategic focus |
|---|---|---|---|---|
| Jiuri New Material | 2.30 | 1.99 | H1 2026 revenue RMB 867M (+21.6%), net profit RMB 43M — returned to profit; photoinitiators 77.5% of revenue, overseas 37.9% | Full-category scale + upstream benzoic-acid integration; investing in photoresists and photosensitizers |
| Qiangli New Material | 1.70 | 0.73 | FY2025 revenue RMB 989M (+7.1%), net loss RMB 127M (narrowed 29.9%); photoresist-grade products 42.6% of revenue, R&D intensity 10.0% | Exiting the commodity price war to focus on PSPI and semiconductor photoresist PAG |
| Yangfan New Material | 0.80 | 0.40 | 2025 subsidiary fire forced a production halt for rectification, capping capacity | Single-product champion via 907 and the ITX series |
| Gurun Technology | n.a. | n.a. | Unlisted, capacity not disclosed | Differentiation in cationic and niche categories |
One caution when reading the table: don't judge competitiveness by capacity ranking. Jiuri's 23,000 t of capacity produced 19,900 t — 87% utilization; Qiangli's 17,000 t produced 7,300 t — just 43%. The gap isn't orders; Qiangli reserves capacity for photoresist customers with longer qualification cycles. Behind these two utilization numbers sit two entirely different business models.
An easily overlooked policy variable: in H1 2026, certain photoinitiator products had their VAT export rebates cancelled. For an industry where overseas revenue approaches 40%, this directly erodes export price competitiveness and will accelerate the exit of low-end capacity.
The demand mix is highly concentrated: UV coatings above 40% and UV inks above 25% — together nearly 70%. Both are mature and growing steadily; the real increment sits in electronics, 3D printing and semiconductor lithography.
Note: indicative China-market split based on public statistics and industry structure; not precise measured values.
The clearest picture of this industry's structure comes from the product-level disclosure in Qiangli New Material's FY2025 annual report:
| Product line | Gross margin | Share of revenue |
|---|---|---|
| Commodity photoinitiators | 2.48% | RMB 266M · 26.8% of total |
| PCB photoresist grade | 37.14% | RMB 184M · 18.6% of total |
| Semiconductor photoresist grade | 41.74% | RMB 66M · 6.7% of total |
| LCD photoresist grade | 60.85% | RMB 172M · 17.4% of total |
Note the contrast: the largest revenue line — commodity photoinitiators — contributes almost zero gross profit, while LCD photoresist-grade products at just 17.4% of revenue contribute over 40% of gross profit. This maps the industry's three-tier value distribution:
The conclusion is blunt: the way out for China's photoinitiator industry is not "building another production line" but "getting the same line's products onto photoresist customers' qualification lists." Capacity takes a year to build; qualification takes three.
Reverse variables worth watching: electron-beam (EB) curing needs no initiator in some thick-film and packaging scenarios; and commodity capacity is still expanding — the preconditions for price war have not disappeared. The recovery will be structural, not across the board.
If you have any market issues or product requirements, please feel free to contact LIFTCHEM for communication.
Photoinitiators · Functional monomers · Specialty chemicals — supply and technical discussion welcome.
Industry totals and capacity: Radiation Curing Committee of the China Photosensitive Society; Zhiyan Consulting. Prices: Baichuan Yingfu monitoring (Jul–Aug 2025 ex-works). Company financials: Jiuri New Material (688199.SH) 2025/2026 interim reports; Qiangli New Material (300429.SZ) FY2025 annual report product-level disclosure; Yangfan New Material (300637.SZ) public announcements. International landscape: BASF press release, Aug 11, 2016 — "BASF divests global photoinitiator business to IGM Resins"; IGM Resins website. Third-party market-research figures that contradict each other (e.g., listing BASF — divested in 2016 — as global No.1) were excluded.
This article is compiled from public information for industry exchange only; it is not investment advice. All company figures come from public disclosures; historical data does not guarantee future performance.